✅ EKS Cluster 구축
eks cluster를 먼저 구축한다.

vpc를 선택하고 public subnet을 선택한다.


이후, eks worker node를 설정한다

t2.micro와 t2.small 두개의 워커 노드를 설정한다.

✅ Kubectl 설정
public subnet의 ec2에 접속한 뒤 eks를 연결해주어야 한다.
이때, 버전문제로 인해 1.23.6 버전의 kubectl을 다운받아 주어야 한다.
$ aws configure

# kubectl 다운
$ curl -LO https://dl.k8s.io/release/v1.23.6/bin/linux/amd64/kubectl
$ sudo install -o root -g root -m 0755 kubectl /usr/local/bin/kubectl
$ aws eks update-kubeconfig --region ap-northeast-2 --name eks-cluster

# 연결된 cluster 정보 표시
$ kubectl config get-contexts
CURRENT   NAME                                                          CLUSTER                                                       AUTHINFO                                                      NAMESPACE
*         arn:aws:eks:ap-northeast-2:{arn}:cluster/eks-cluster   arn:aws:eks:ap-northeast-2:{arn}:cluster/eks-cluster   arn:aws:eks:ap-northeast-2:{arn}:cluster/eks-cluster


# 만약 eks 연결 정보 삭제하고 싶다면
kubectl config get-contexts
kubectl config unset contexts.arn:aws:eks:ap-northeast-2:{arn}:cluster/eks-cluster
rm ~/.kube/config
버전 이슈로 인해 많은 트러블 슈팅을 하였는데 하단 글들을 참고했다
- error: exec plugin: invalid apiVersion "client.authentication.k8s.io/v1alpha1" 버전 이슈 트러블 슈팅
- api version 트러블 슈팅
https://peterica.tistory.com/205
kubectl get node를 통해 앞서 생성한 worker node들을 확인해 본다.

잘 생성 되고 연결 된 것을 알 수 있다.
✅ helm chart 이용해 grafana, prometheus, alertmanger 설정
grafana, prometheus, alertmanager을 helm 차트로 설치하기 위해 helm을 설치한다.
$ curl https://raw.githubusercontent.com/helm/helm/master/scripts/get-helm-3 > get_helm.sh
$ sudo chmod 700 get_helm.sh
helm chart를 이용하여 prometheus, alertmanager, grafana를 설치한다.
helm repo add stable https://charts.helm.sh/stable
helm search repo
helm repo update
helm list
helm repo add prometheus-community https://prometheus-community.github.io/helm-charts
helm search repo prometheus
helm install prometheus-community/kube-prometheus-stack --generate-name
생성된 것들을 확인해본다.
$ kubectl get all
외부에서 접속하기 위해 svc의 type을 Loadbalancer로 바꿔주어야 한다.

type : LoadBalancer 로 수정
$ kubectl edit svc kube-prometheus-stack-1689-alertmanager
$ kubectl edit svc kube-prometheus-stack-1689-prometheus
$ kubectl edit svc kube-prometheus-stack-1689819676-grafana

$ kubectl get all
external-ip:port 로 접속하면 된다. (보안그룹 열어주는거 까먹지 않기!)

다음과 같은 페이지들을 확인할 수 있다.


prometheus는 로그인을 통해 접속할 수 있다
id : admin / password : prom-operator

✅ grafana dashboard 설정하기
- Prometheus
datasource -> prometheus를 추가하여 prometheus url을 넣어준다.


13770 dashboard를 import 한다.

다음과 같은 페이지를 볼 수 있다.

- cloudwatch 모니터링
data source 로 access key ID와 secret access key, region등을 설정하여 import 해준다.
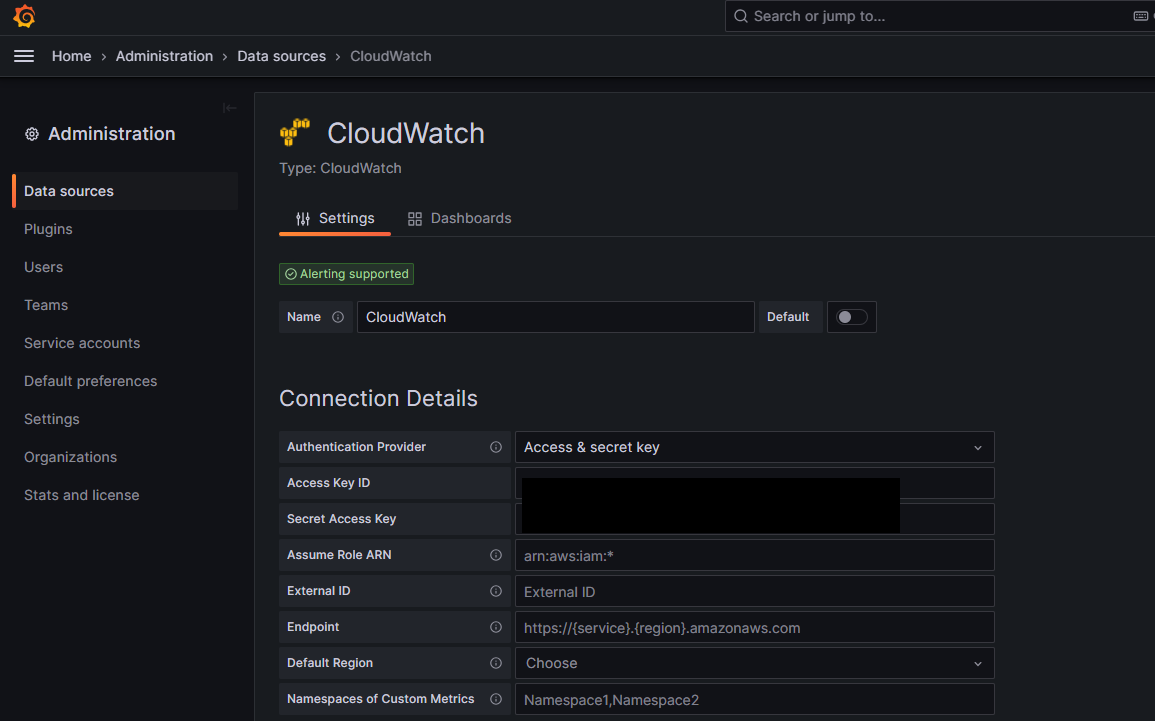
그리고 대시보드를 구성해주면된다.(직접 구성함)

✅ alert manager + slack 연결하기
먼저 slack api url을 받아와야 한다. slack url을 slack_api_url을 가져와 alertmanager.yaml 파일에 넣어준다.
vi alertmanager.yaml
global:
  slack_api_url: "slack url"
route:
  group_by: ['alertname']
  group_wait: 5s
  group_interval: 1m
  repeat_interval: 10m
  receiver: 'slack'
receivers:
- name: 'slack'
  slack_configs:
  - channel: '#prometheus-test'
    icon_emoji: ':bell:'
    send_resolved: true
    title: |-
     [{{ .Status | toUpper }}{{ if eq .Status "firing" }}:{{ .Alerts.Firing | len }}{{ end }}] {{ .CommonLabels.alertname }} for {{ .CommonLabels.job }}
     {{- if gt (len .CommonLabels) (len .GroupLabels) -}}
       {{" "}}(
       {{- with .CommonLabels.Remove .GroupLabels.Names }}
         {{- range $index, $label := .SortedPairs -}}
           {{ if $index }}, {{ end }}
           {{- $label.Name }}="{{ $label.Value -}}"
         {{- end }}
       {{- end -}}
       )
     {{- end }}
    text: >-
     {{ range .Alerts -}}
     *Alert:* {{ .Annotations.title }}{{ if .Labels.severity }} - `{{ .Labels.severity }}`{{ end }}

     *Description:* {{ .Annotations.description }}

     *Details:*
       {{ range .Labels.SortedPairs }} • *{{ .Name }}:* `{{ .Value }}`
       {{ end }}
     {{ end }}
      # text: "<!channel> \nsummary: {{ .CommonAnnotations.summary }}\ndescription: {{ .CommonAnnotations.description }}\nmessage: {{ .CommonAnnotations.message }}"
그리고 slack 알림을 주기위해 secret을 수정한다.
$ kubectl get secret
$ kubectl delete secret alertmanager-kube-prometheus-stack-1689-alertmanager
$ kubectl create secret generic --from-file=alertmanager.yaml alertmanager-kube-prometheus-stack-1689-alertmanager
slack에서 알림이 수신되는 것을 확인할 수 있다.

'DEVELOP > AWS' 카테고리의 다른 글
| AWS | CloudFormation 활용하여 Macie + Slack 알람 구성하기 (0) | 2023.07.20 |
|---|---|
| AWS | EKS mariadb 구축하기 (0) | 2023.07.20 |
| DOCKER | docker-compose.yml 프로메테우스 + 그라파나 컨테이너 생성하기 (0) | 2023.06.19 |
| AWS | EKS, ECR (0) | 2023.06.16 |
| KUBERNETES | GCP에서 쿠버네티스 사용해보기 (0) | 2023.06.08 |